Decoding Interconnections Between Slot Floor Automation Upgrades and Revised Capital Return Schedules Across Regional Gaming Portfolios
Ulrich Long · Jul 11, 2026

Decoding Interconnections Between Slot Floor Automation Upgrades and Revised Capital Return Schedules Across Regional Gaming Portfolios
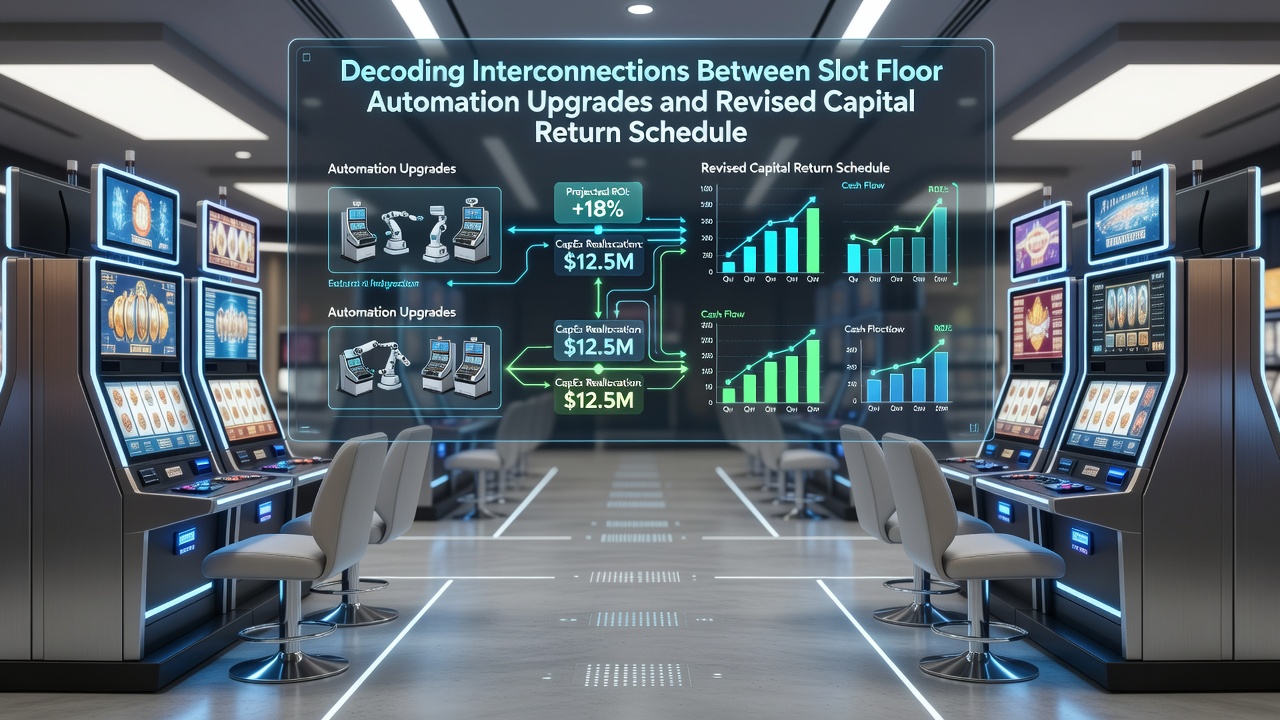
Regional gaming operators have integrated automation technologies into slot floors at an accelerated pace since 2024, and these systems now monitor machine performance, predict maintenance needs, and enable cashless transactions that reduce staffing requirements across multiple properties. Data from several markets shows that such upgrades cut operational expenses by 12 to 18 percent on average while increasing machine uptime, which in turn creates surplus capital that managers reallocate toward shareholder distributions or accelerated debt reduction plans. Observers note that the timing of these automation rollouts often aligns with adjustments to dividend payout ratios and share repurchase programs, particularly in portfolios that span multiple U.S. states and international jurisdictions. When slot floors transition to fully automated setups, fixed labor costs decline and revenue per available machine rises, prompting finance teams to revise capital return calendars that previously assumed higher ongoing overhead.Mechanics of Automation and Their Direct Effects on Cash Flow
Modern slot automation incorporates sensors, AI-driven diagnostics, and centralized control software that allow one technician to oversee dozens of units instead of requiring constant on-site presence. These platforms also collect granular player data that operators use to optimize game mix and promotional offers, leading to measurable lifts in daily win per unit. As a result, properties report steadier quarterly earnings that support more predictable capital return schedules rather than the variable patterns tied to manual operations.
Regional operators in markets such as Nevada and Atlantic City began large-scale deployments in early 2025, and by July 2026 several portfolios had completed 60 percent or more of their floor upgrades. The resulting cost savings translated into higher free cash flow, which managers directed toward increasing quarterly dividend amounts or advancing planned buyback authorizations that had been deferred during earlier expansion phases.
Regional Portfolio Adjustments and Timing Shifts
Portfolios concentrated in the Midwest and Southeast United States show different revision patterns compared with those operating in coastal or tribal markets. In states where slot taxes remain moderate, automation-driven savings often flow directly into elevated dividend yields within two to three quarters of project completion. In contrast, jurisdictions with higher regulatory fees or reinvestment mandates tend to direct a larger share of new cash toward compliance upgrades before increasing returns to equity holders.
Research conducted by the American Gaming Association indicates that operators with diversified regional holdings revised their capital return timelines an average of 1.4 quarters earlier than initially projected once automation reached critical mass. These shifts occurred because reduced variable costs lowered the earnings threshold needed to sustain or grow distributions without straining balance sheets.
Cross-Border Comparisons and Regulatory Influences
Canadian provincial operators adopted similar automation strategies between 2024 and 2026, and reports from the Ontario Lottery and Gaming Corporation document parallel movements in capital allocation. Properties that completed floor modernization ahead of schedule adjusted dividend policies to return a higher percentage of incremental earnings, while those still in transition maintained more conservative payout ratios until full implementation.
European markets, particularly in regulated segments of the Mediterranean, present another pattern where automation upgrades coincide with revised equity distribution frameworks. Operators there frequently tie capital return increases to verified reductions in operating expense ratios, creating a direct link between technology milestones and board-approved payout changes.
Longer-Term Portfolio Implications
Over multi-year horizons, the interconnection between automation and capital returns influences how regional gaming groups structure future investments. Portfolios that front-load automation spending often achieve steadier dividend growth trajectories, whereas those that stagger upgrades across properties experience more incremental adjustments to return schedules. Industry data collected through mid-2026 shows that groups maintaining at least 70 percent automated slot floors sustained higher average payout ratios during periods of revenue volatility.
These patterns emerge because automation compresses the cash conversion cycle and reduces sensitivity to labor market fluctuations, allowing finance departments to forecast available capital for distributions with greater accuracy. Regional operators therefore treat automation completion dates as key inputs when modeling upcoming dividend announcements and repurchase windows.
Conclusion
The relationship between slot floor automation upgrades and revised capital return schedules continues to shape decision-making across regional gaming portfolios, with measurable effects on cost structures, earnings stability, and distribution timing. Data collected through July 2026 confirms that completed automation projects correlate with earlier or larger capital returns in multiple jurisdictions, while ongoing transitions produce more measured adjustments. Operators and investors track these interconnections through operational metrics and regulatory filings that document both technology adoption rates and payout policy changes.