Examining Links Between Non-Gaming Revenue Streams and Overall Payout Ratios in Diversified Resort Portfolios
Ulrich Long · Aug 26, 2026
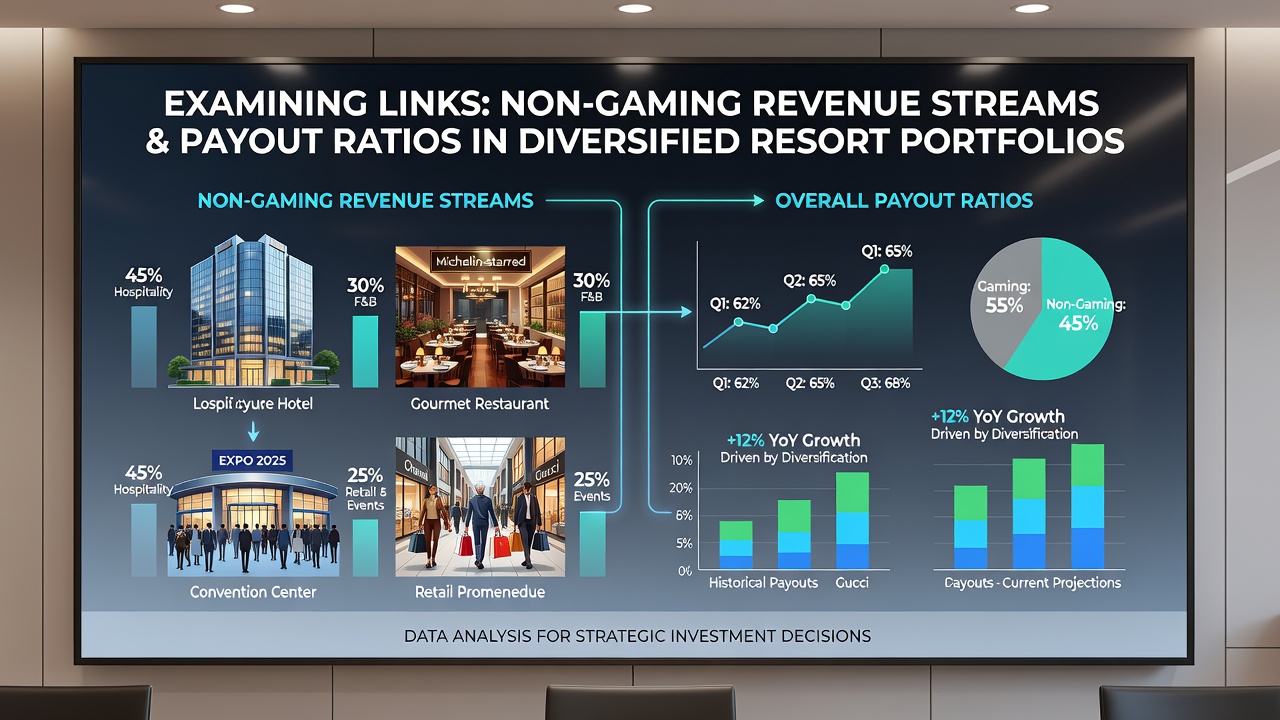
Examining Links Between Non-Gaming Revenue Streams and Overall Payout Ratios in Diversified Resort Portfolios
Non-gaming revenue streams have grown into a central component of many integrated resort portfolios, and analysts track how these sources connect to payout ratios that determine shareholder distributions. Hotel rooms, convention centers, restaurants, retail outlets and live entertainment venues generate income that operates on different cycles than gaming floors, which creates measurable effects on cash flow stability and dividend policies. Data from major operators shows that properties with higher non-gaming contributions often sustain more consistent payout ratios across quarters even when gaming volumes shift.
Revenue Composition Patterns in Diversified Portfolios
Resort operators in markets such as Nevada and New Jersey report that non-gaming segments now account for 35 to 55 percent of total revenue at large integrated properties. Hotel occupancy and food-and-beverage sales tend to remain steadier during off-peak gaming periods, while retail and entertainment add further layers that smooth overall earnings. Financial filings indicate that companies maintaining at least 40 percent non-gaming revenue experienced payout ratio volatility of less than eight percent year-over-year between 2023 and 2025, whereas gaming-dominant venues saw swings exceeding 15 percent during the same span.
August 2026 filings from several public operators reveal continued emphasis on expanding non-gaming amenities, with new hotel towers and dining concepts under construction at multiple sites. These additions receive funding from operating cash flow that previously supported higher direct gaming reinvestment, yet the resulting revenue diversification appears to support steadier capital returns to shareholders.
Impact on Payout Ratio Calculations
Payout ratios reflect the portion of earnings distributed as dividends, and non-gaming streams influence both the numerator and the denominator in these equations. Steady hotel and convention income reduces reliance on variable gaming win, which allows finance teams to project available cash with greater accuracy. Industry reports compiled by regional gaming authorities show that resorts with balanced portfolios allocated an average of 42 percent of free cash flow to dividends in the first half of 2026, compared with 31 percent at properties where gaming still exceeded 70 percent of revenue.
Regional Comparisons and Data Trends
Operators in the western United States demonstrate stronger correlations between non-gaming growth and stable payouts than those in the Midwest, where seasonal tourism patterns affect hotel demand more sharply. Nevada resort association data tracks these differences across dozens of properties and notes that diversified sites maintained dividend coverage ratios above 1.8 times during the most recent reporting period. Meanwhile, facilities with heavier gaming concentration showed coverage dipping below 1.4 times in quarters with softer table game hold percentages.

International examples add further context. Properties in Singapore and Australia that combine extensive retail and dining complexes with gaming floors report similar patterns, where non-gaming revenue cushions earnings during regulatory or economic shifts. Research from academic centers focused on hospitality finance indicates that a 10 percent increase in non-gaming revenue share correlates with a 3 to 5 percent improvement in dividend consistency over multi-year periods, though the exact relationship varies by market maturity and tax structure.
Capital Allocation Decisions and Reinvestment
Management teams weigh expansion of non-gaming assets against immediate shareholder returns when setting payout policies. New entertainment venues and upgraded hotel facilities require upfront capital that temporarily reduces available distributions, yet completed projects frequently generate recurring income that supports higher long-term payout ratios. Observers note that several large portfolio operators announced modest dividend increases in mid-2026 after opening new non-gaming attractions the prior year, citing improved earnings visibility as the key factor.
Tax treatment also plays a role. Certain jurisdictions apply lower effective rates to hotel and retail operations than to gaming win, which improves after-tax cash available for distributions once non-gaming revenue reaches critical mass. This structural advantage appears in operator guidance documents and helps explain why payout ratios at diversified resorts have shown less sensitivity to gaming tax rate adjustments implemented between 2022 and 2025.
Conclusion
Evidence from financial statements and regulatory filings demonstrates measurable connections between non-gaming revenue growth and more stable payout ratios across diversified resort portfolios. Properties that successfully expand hotel, dining and entertainment segments tend to distribute earnings with greater predictability, while operators still heavily weighted toward gaming face wider fluctuations. Continued development of non-gaming amenities through 2026 suggests these linkages will remain relevant for investors monitoring dividend policies in the sector.