How Visitor Age Demographics Influence Capital Return Mechanisms for Large-Scale Entertainment Venues
Carlo Schmidt · Jul 29, 2026
How Visitor Age Demographics Influence Capital Return Mechanisms for Large-Scale Entertainment Venues
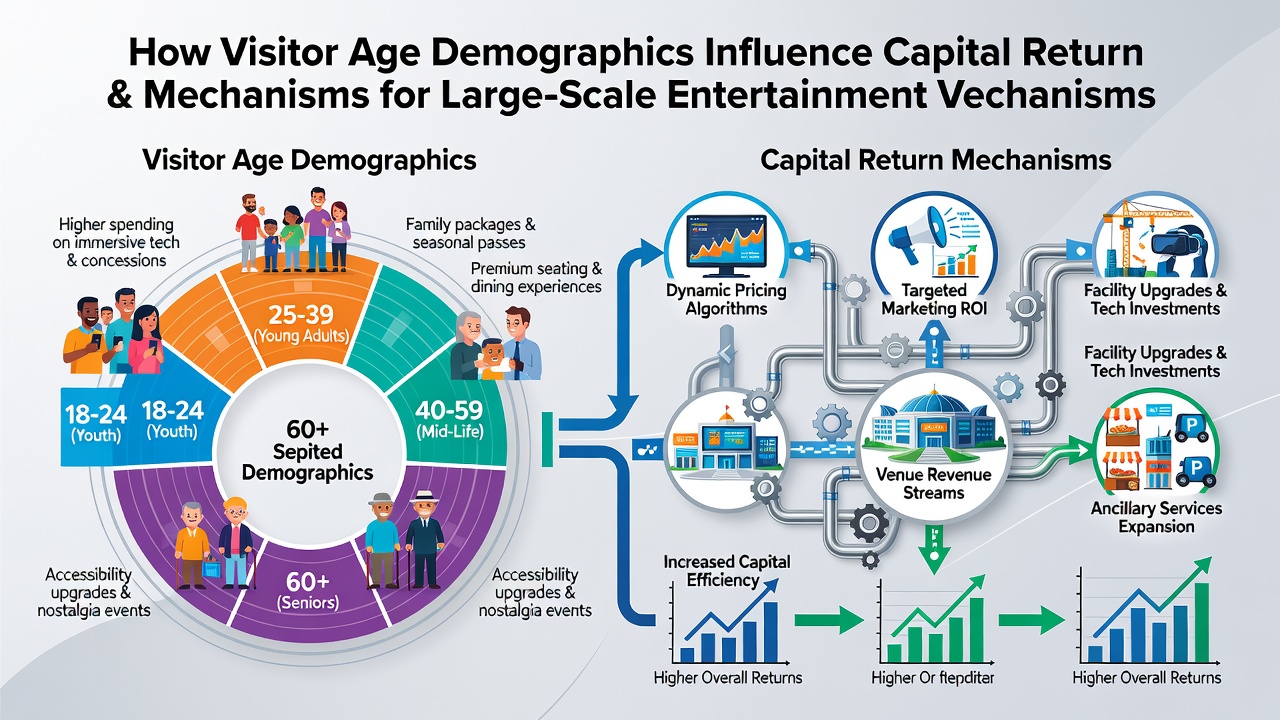
Visitor age demographics shape the financial strategies that large-scale entertainment venues employ when deciding on capital returns such as dividends and reinvestment programs. Data from multiple markets indicate that different age cohorts generate distinct spending patterns which in turn affect how operators allocate profits between shareholder distributions and facility upgrades.
Age-Based Spending Variations in Entertainment Settings
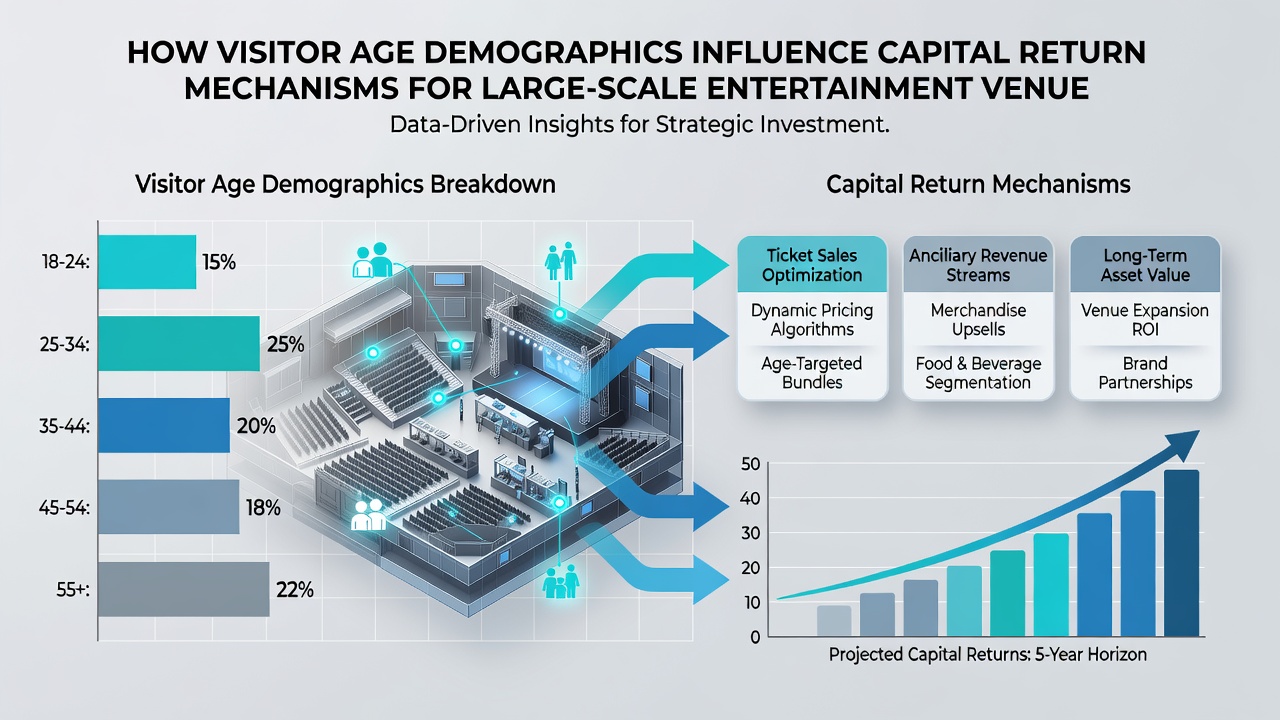
Observers note that younger visitors between 18 and 34 tend to direct spending toward interactive attractions, digital gaming options, and short-duration events, while middle-aged groups from 35 to 54 often favor a mix of dining, shows, and table games that produce steadier per-visit revenue. Older cohorts aged 55 and above concentrate activity on slot machines and loyalty programs that deliver consistent daily play volumes. These patterns emerge consistently in reports covering integrated resorts in Asia, North America, and Australia.
Research from university studies shows that venues tracking these differences adjust capital return timelines accordingly. Facilities with higher proportions of older visitors maintain more predictable cash flows that support regular dividend schedules, whereas those attracting younger crowds frequently channel earnings into technology upgrades that extend payout cycles.
Revenue Allocation Decisions Driven by Demographic Mix
Operators monitor demographic shifts to determine reinvestment ratios versus direct returns to equity holders. When visitor data reveals growing shares of middle-aged families, management teams often approve expansions in family-oriented amenities because those additions sustain longer visit durations and higher total spend per trip. This approach alters the portion of profits available for immediate capital returns.
Figures released in July 2026 from several regional gaming authorities highlight how venues in mature markets adjusted dividend policies after observing increases in visitors over 55. Those properties reported stable earnings that permitted continued quarterly distributions without reducing maintenance reserves.
Regional Examples and Policy Adjustments
One major resort group in the western United States altered its capital return framework after demographic surveys showed rising attendance from visitors aged 35 to 54. The company redirected a larger share of operating cash flow toward mid-tier hotel renovations rather than accelerating share buybacks. Similar adjustments appear in records from operators in Macau and Singapore where younger tourist inflows prompted investments in entertainment districts instead of immediate dividend increases.
According to analyses by the Australian Institute of Health and Welfare, entertainment venues serving higher percentages of older patrons experience lower volatility in daily revenue, which supports more reliable capital return mechanisms. These findings align with observations from Canadian provincial regulators that track how age composition correlates with long-term distribution stability.
External Factors Interacting with Demographics
Regulatory changes and economic conditions interact with demographic trends to influence payout decisions. When jurisdictions modify tax structures on specific gaming products, operators respond by evaluating which age groups drive those products and then recalibrating reinvestment plans. Data released through industry associations demonstrate that venues with balanced age profiles maintain greater flexibility in timing equity distributions during periods of market fluctuation.
Academic papers from institutions in Europe and Asia further illustrate that loyalty program participation rates vary sharply by age, with older visitors showing higher redemption consistency that smooths revenue streams used for shareholder returns.
Conclusion
Demographic data collection and analysis now form core components of capital planning at large entertainment venues. Operators that align return mechanisms with the spending characteristics of their primary visitor age groups achieve more consistent financial outcomes across economic cycles. Continued tracking of these patterns enables venues to refine allocation strategies while meeting obligations to both investors and operational needs.