Intersections of Sports Wagering Growth and Shareholder Distribution Adjustments Among Casino Equities
Amir Richter · Aug 22, 2026
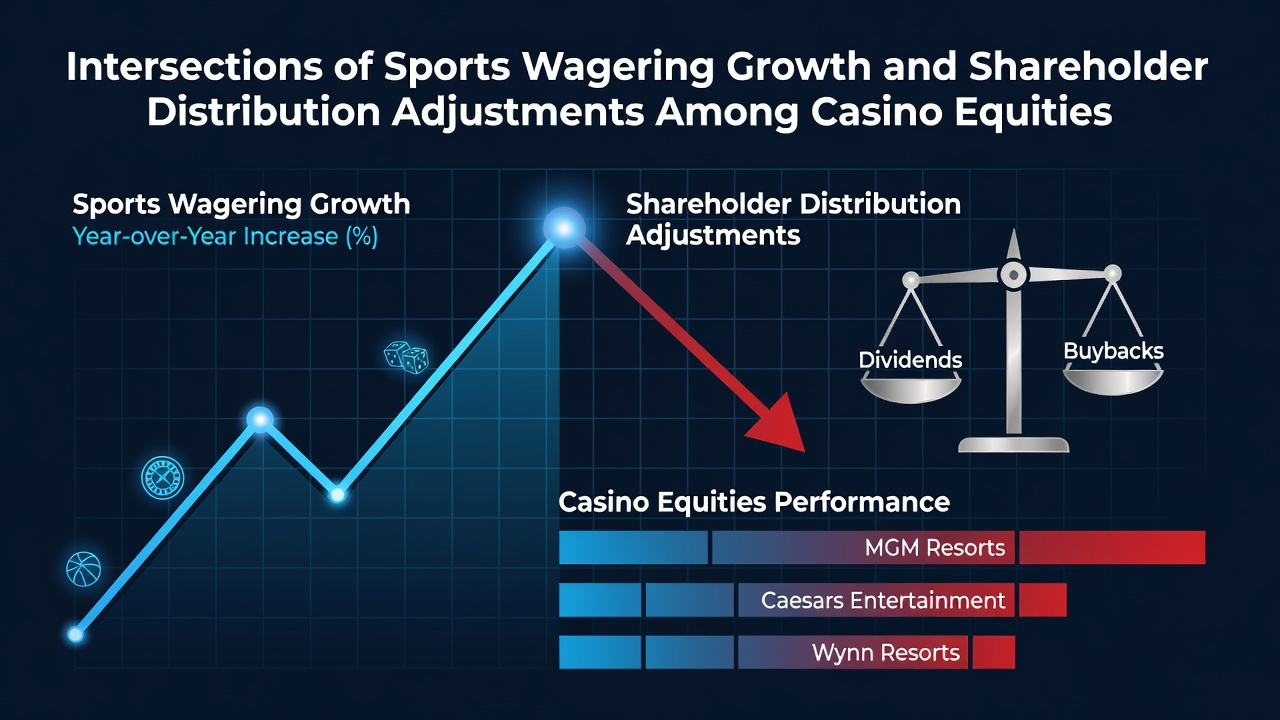
Intersections of Sports Wagering Growth and Shareholder Distribution Adjustments Among Casino Equities
Observers note that sports wagering expansion has created measurable shifts in revenue streams for publicly traded casino operators since the 2018 Supreme Court decision opened state-level markets across the United States. Data from multiple jurisdictions shows online and retail sportsbooks now contribute between 8 and 22 percent of total gaming revenue at major integrated resort companies depending on market maturity. Those figures have prompted several equity issuers to recalibrate capital return programs including dividend increases, special payouts, and share repurchase authorizations.
Revenue Composition Changes Across Major Operators
Figures released by state regulators in Nevada, New Jersey, and Pennsylvania reveal that sports betting handle reached record levels through the first half of 2026, with online platforms accounting for the largest share of incremental growth. Casino companies that secured early mobile licenses report that sports wagering margins, while thinner than table games or slots, deliver higher customer acquisition velocity and improved cross-sell rates into hotel and entertainment segments. Researchers tracking equity filings observe that operators with diversified sportsbooks have posted steadier year-over-year EBITDA growth compared with peers still reliant on traditional gaming floors.
Adjustments to shareholder distributions have followed these revenue patterns in several documented cases. One large operator authorized a 15 percent dividend increase in the second quarter of 2026 after sports wagering contributed more than $180 million in quarterly revenue, while another entity shifted a portion of expected cash flow toward an accelerated buyback program rather than a base dividend hike. Such moves reflect board-level decisions that tie payout ratios directly to the stability and scale of new betting segments.
Capital Allocation Responses in Different Jurisdictions
State tax structures influence how operators allocate incremental sports wagering profits. Jurisdictions with lower effective tax rates on mobile betting have seen faster deployment of free cash flow into shareholder returns, whereas higher-tax markets have prompted more conservative reinvestment before distribution changes. Data compiled through August 2026 indicates that companies operating in multiple states maintain separate capital return policies segmented by regional contribution margins.
Market Maturity and Payout Timing
Markets that legalized sports wagering earlier show clearer correlations between betting revenue stabilization and dividend policy updates. In states where three or more years of operating history exist, analysts have documented a pattern of initial reinvestment phases followed by measured increases in ordinary dividends or one-time capital returns once handle growth rates moderate. Newer markets continue to absorb cash for marketing, technology, and retail integration, delaying distribution adjustments until volume metrics reach sustainable thresholds.
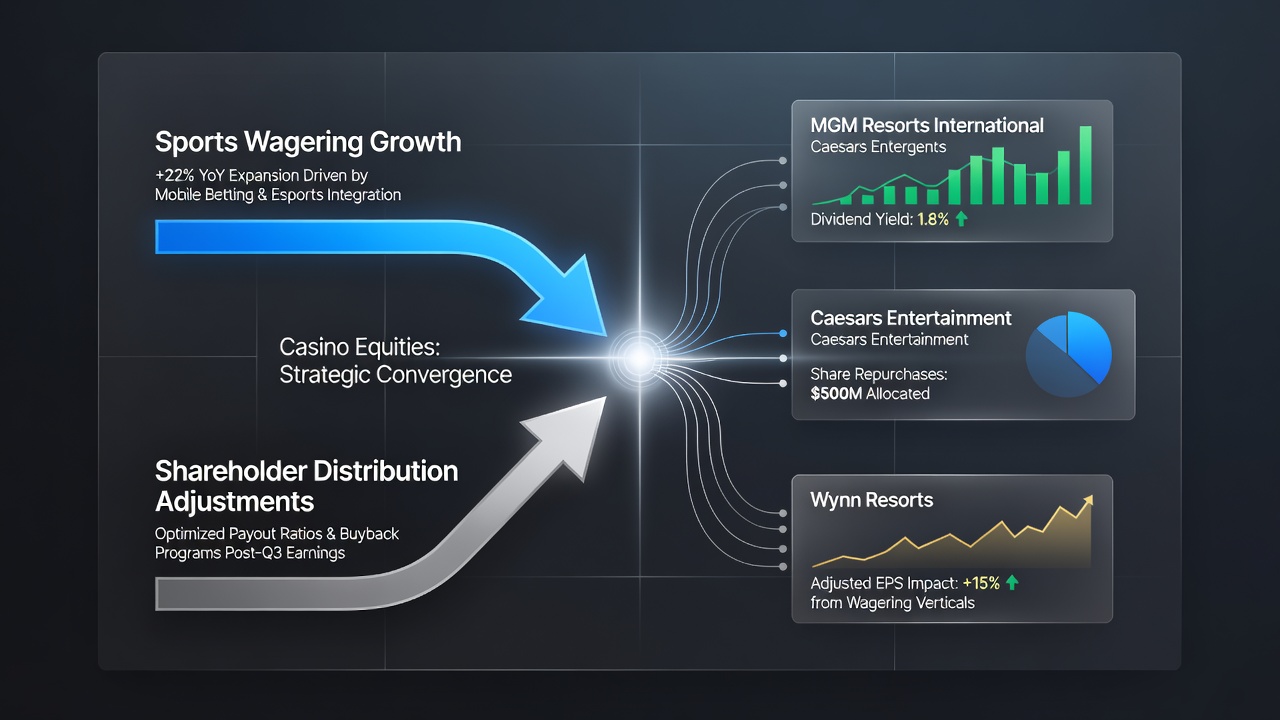
Equity Market Signals and Analyst Tracking
Equity research reports from firms covering the gaming sector track distribution revisions against sports wagering key performance indicators such as handle per active user and retention rates. Investors have responded to announcements that link payout changes explicitly to betting segment performance, with share price movements reflecting both the size of the distribution adjustment and the perceived durability of the underlying revenue. According to data aggregated by the American Gaming Association, sports wagering now represents a growing percentage of total industry revenue, which has encouraged some issuers to revise long-term payout guidance upward.
International comparisons add further context. Operators in Australia and select Canadian provinces that expanded sports betting products earlier demonstrate similar sequencing: initial capital expenditure for platform development, followed by incremental shareholder returns once contribution margins stabilize. Reports from the Australian Gambling Research Centre document parallel capital allocation patterns among listed entities in those markets.
Regulatory and Tax Factors Affecting Distributions
Changes in state-level tax rates on sports wagering directly affect available cash for distributions. Several legislatures considered or enacted rate adjustments during 2025 and 2026 sessions, prompting operators to model multiple scenarios before finalizing dividend or buyback commitments. Companies with significant exposure to a single high-tax jurisdiction have tended toward more modest distribution increases, preserving flexibility should tax liabilities rise. Conversely, operators with balanced geographic footprints have demonstrated greater willingness to raise base dividends when sports wagering contributes consistently across lower-tax markets.
Conclusion
Available evidence shows that sports wagering growth continues to intersect with shareholder distribution decisions at casino equities through measurable revenue contributions and resulting capital allocation choices. Operators adjust payout policies according to the maturity of betting operations, prevailing tax regimes, and the relative stability of new income streams. As additional states finalize regulatory frameworks and more data accumulates through late 2026, further refinements to distribution strategies are expected among issuers with material sports wagering exposure.