Linking Major League Sports Schedules to Fluctuating Return Rates in Sports Wagering Equities
Amir Richter · Aug 24, 2026
Linking Major League Sports Schedules to Fluctuating Return Rates in Sports Wagering Equities
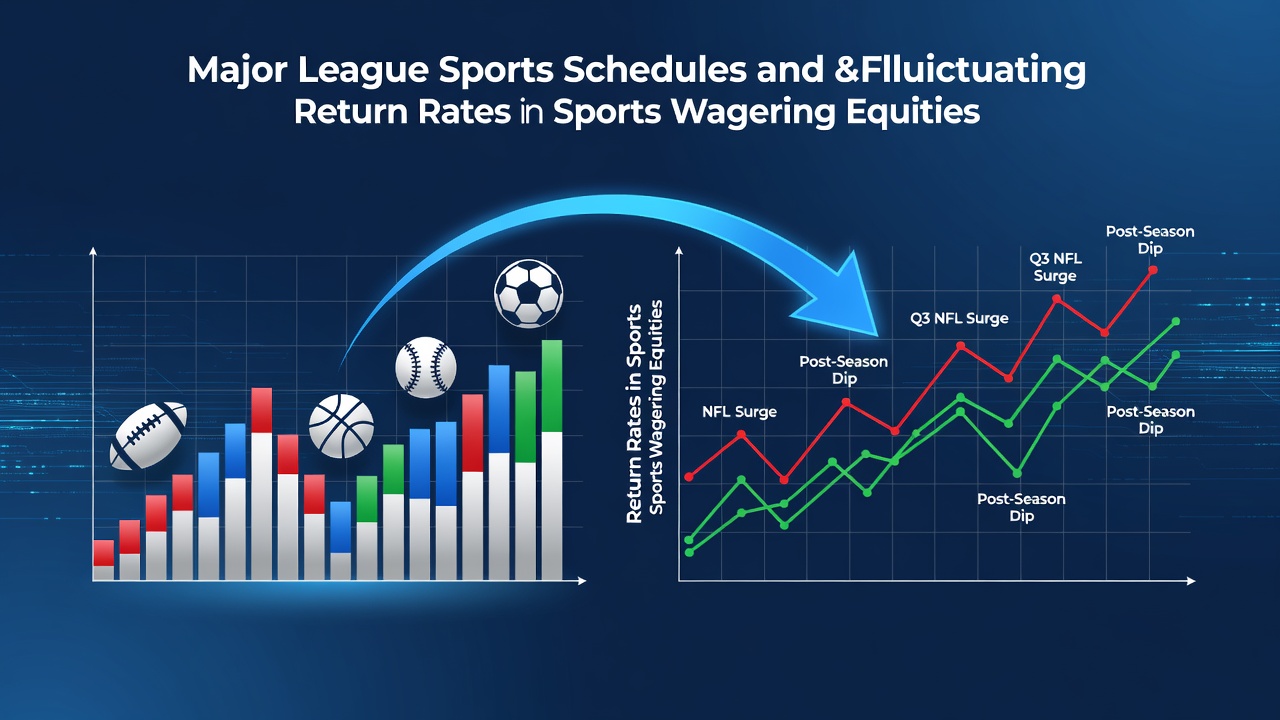
Professional sports calendars create measurable patterns in betting activity that directly affect revenue streams for publicly traded wagering operators, and those patterns translate into observable shifts in equity returns for companies whose valuations depend on handle volume and user engagement across football, basketball, baseball, and hockey seasons. Observers note that the staggered start and end dates of major North American leagues produce distinct peaks and troughs in daily active users and gross gaming revenue, which analysts track against stock price movements for operators including DraftKings and Flutter Entertainment. Data from regulated markets shows that NFL regular-season weeks consistently generate higher handle than off-season periods, while NBA and NHL overlapping schedules create sustained mid-winter volume that supports more stable quarterly results for multi-state operators.
Seasonal Schedule Overlaps and Volume Spikes
MLB’s 162-game slate runs from late March through early October, creating a prolonged baseline of daily baseball betting markets that operators price and promote continuously, whereas the NFL’s compressed 18-week regular season concentrates heavy action into fewer weekends and produces sharper weekly revenue swings. Researchers tracking New Jersey sports betting data found that combined NFL and college football weekends lifted statewide handle by 35 to 50 percent above non-football weekends during the 2025 season, and those spikes correlated with same-week gains in daily active users reported by major mobile platforms. The NBA and NHL seasons stretch from October into June with frequent overlap, supplying operators with simultaneous basketball and hockey betting options that maintain engagement levels through the winter months when MLB activity is absent.
Equity Return Patterns Tied to Calendar Events
Public companies whose primary revenue derives from sports wagering equities exhibit return volatility that aligns with these calendar events rather than broader equity market cycles. Studies covering the period from 2022 through 2025 indicated that DraftKings shares posted average weekly returns 1.8 times higher during NFL regular-season windows than during the league’s off-season months, while Flutter Entertainment’s international and U.S. segments showed parallel movements tied to the same schedule. August 2026 marks the transition into NFL training-camp coverage and early futures markets, a period when operators typically report elevated marketing spend ahead of the September kickoff and when equity analysts adjust models to reflect expected September-through-January revenue concentration.

MLB playoffs in October and the World Series in late October or early November extend baseball betting windows beyond the regular season, yet the incremental handle remains smaller than football-driven surges, producing more modest equity reactions. NBA and NHL playoff runs from April through June overlap with MLB’s opening months, creating a secondary volume layer that cushions operators against the sharp drop-off that follows the Super Bowl. Those who monitor trading volumes around earnings releases observe that operators reporting results immediately after the Super Bowl or after March Madness frequently cite schedule-driven handle changes as primary factors in quarterly performance.
Regulatory Data and Cross-Market Comparisons
State-level regulatory filings supply granular evidence linking schedules to returns. Figures released by the New Jersey Division of Gaming Enforcement document monthly sports wagering handle broken down by sport, revealing consistent February-through-February patterns that mirror league calendars across multiple years. Parallel data from the Pennsylvania Gaming Control Board shows similar alignment, with basketball and hockey months sustaining elevated totals once football concludes. Operators active in multiple jurisdictions can therefore diversify schedule risk by balancing exposure across states where different leagues dominate local preferences, an approach reflected in equity valuation models that weight multi-state footprints more favorably than single-market exposure.
Academic work examining U.S. and Canadian markets further supports these connections. A 2025 analysis published by researchers at the University of Nevada, Las Vegas examined daily betting data against league schedules and identified statistically significant return premiums for wagering equities during periods when at least two major leagues operated concurrently. The study noted that periods of minimal overlap, such as early August before NFL preseason games begin, produced lower handle and correspondingly muted trading activity in related equities. Operators have responded by expanding non-sports offerings and international markets, yet core performance metrics remain anchored to North American league calendars because those schedules drive the largest absolute handle volumes.
Conclusion
League schedules function as predictable external variables that shape both operational cash flows and equity pricing for sports wagering companies, and regulatory data sets now provide sufficient history to quantify those relationships across multiple seasons. Market participants incorporate these calendar effects into forecasting models, adjusting expected returns around known start dates, playoff windows, and off-season gaps. As more states finalize sports wagering regulations and additional operators reach public markets, the linkage between major league timetables and fluctuating equity returns will remain a central factor in valuation and risk assessment for the sector.