Seasonal Payout Patterns in Resort Gaming Equities: A Calendar-Based Analysis of Yield Dynamics
Amir Richter · May 16, 2026
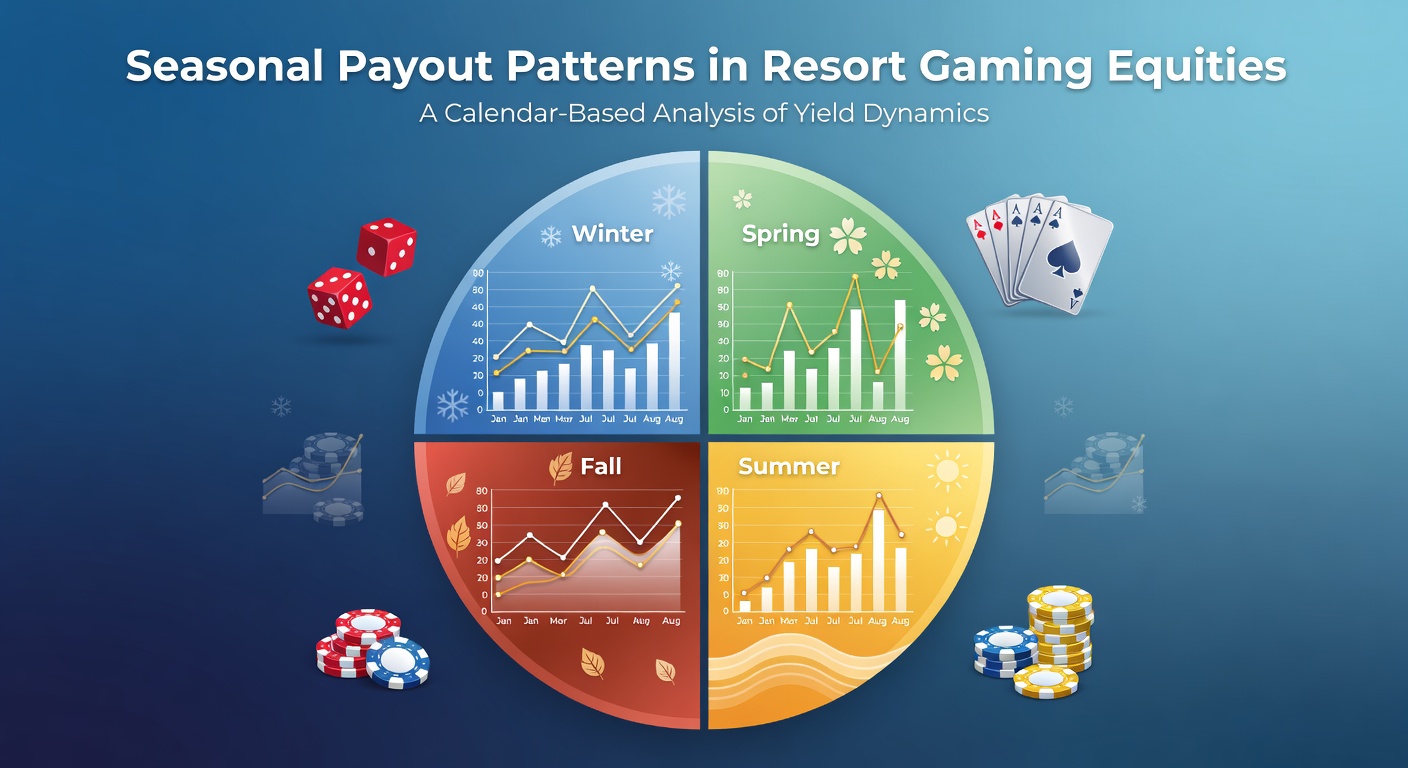
Seasonal Payout Patterns in Resort Gaming Equities: A Calendar-Based Analysis of Yield Dynamics
Resort gaming equities demonstrate measurable seasonal shifts in dividend yields and payout ratios that align closely with tourism cycles and regional visitor volumes. These patterns emerge from quarterly financial disclosures that gaming operators file with regulators and exchanges where analysts track revenue spikes during peak travel months and corresponding adjustments in cash distributions to shareholders.
Calendar Frameworks That Shape Yield Timing
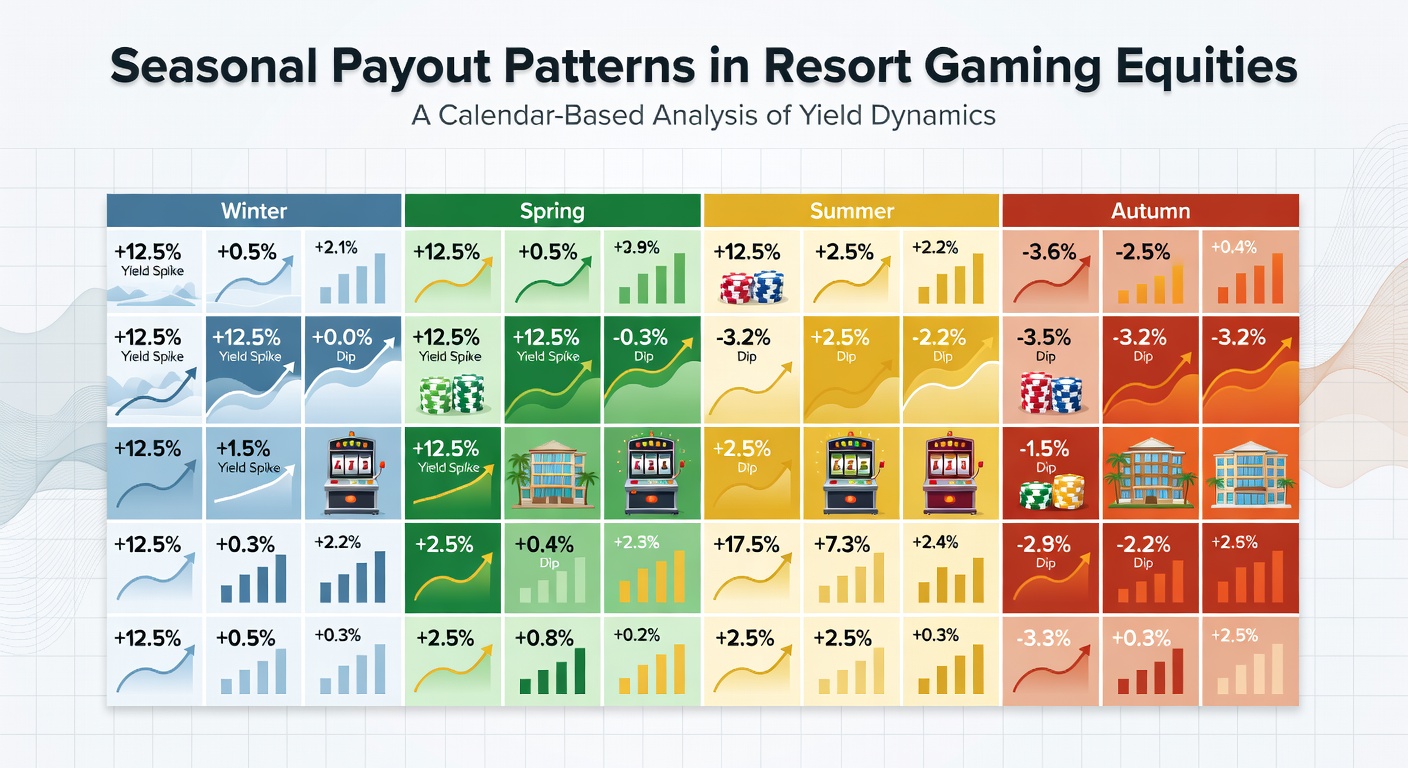
Equity yields in the resort gaming sector often rise during the second and third quarters when summer travel accelerates visitation to properties in Las Vegas, Macau and regional markets across Australia. Data compiled from operator filings shows average yield increases of 12 to 18 percent between April and September compared with winter quarters for companies with significant resort footprints. Observers note that these movements coincide with higher room occupancy and table game hold percentages rather than any deliberate change in dividend policy.
Winter quarters produce more variable outcomes depending on the geographic mix of assets. Properties that rely on holiday travel or ski tourism maintain steadier cash flows while those dependent on convention traffic experience sharper revenue drops that compress available payout capital. Researchers tracking multi-year datasets find that the fourth quarter frequently serves as a reset period where operators evaluate full-year performance before announcing special dividends or adjusting regular payout schedules.
Regional Differences in Seasonal Yield Behavior
North American resort operators tend to front-load larger distributions in the spring and early summer months to align with earnings releases that capture strong first-half results. In contrast, Asian gaming equities linked to Macau often show yield compression in the second quarter followed by recovery in the fourth quarter as Chinese New Year travel patterns influence visitor arrivals. Analysts who examine cross-listed stocks observe that these staggered cycles create opportunities for calendar-based allocation strategies among institutional holders.
What's notable is how Australian resort properties introduce an additional layer of variation because their peak seasons run counter to Northern Hemisphere patterns. Data from operators in New South Wales and Queensland indicate elevated yields between November and February that offset softer periods during the Northern summer. This geographic offset means global gaming equity portfolios can experience smoothed aggregate yields when holdings span multiple hemispheres.
Operational Metrics Driving Payout Adjustments
Slot machine win per unit and average daily room rates serve as leading indicators that operators and analysts monitor when forecasting seasonal payout capacity. Figures released by the Nevada Gaming Control Board reveal consistent correlations between elevated summer win rates and subsequent dividend declarations announced in August earnings calls. Those correlations strengthen when operators maintain conservative debt levels that allow greater flexibility in returning capital during high-cash-flow periods.
Capital expenditure cycles also influence timing because many resort operators schedule major renovations during shoulder seasons when visitor traffic declines. These planned outlays reduce free cash flow available for dividends in the short term but support higher yields in subsequent peak periods once upgraded facilities reopen. Studies of historical capex schedules show that companies announcing projects in the first quarter typically restore or increase payouts by the following third quarter.
Current Observations in May 2026
As of May 2026 operators have begun releasing preliminary indicators for the spring shoulder period that suggest steady but not exceptional cash generation across most resort portfolios. Early filings indicate that operators with diversified international holdings maintain payout ratios near the upper end of historical ranges while single-market operators show more conservative distributions ahead of expected summer demand. Market participants review these releases to calibrate expectations for third-quarter announcements that historically drive the largest seasonal yield movements.
Regulatory filings further indicate that several major operators have adjusted guidance language to reflect normalized post-pandemic travel patterns rather than exceptional surges. This normalization allows more predictable calendar modeling because extreme volatility from 2020 through 2023 no longer distorts baseline seasonal comparisons. Observers tracking these updates note that dividend safety metrics remain within acceptable bands for most investment-grade gaming equities.
Conclusion
Seasonal payout patterns in resort gaming equities arise from measurable intersections of tourism demand, operational metrics and capital allocation decisions that recur across calendar years. Calendar-based analysis reveals consistent yield expansion during peak travel quarters offset by measured distributions in slower periods. Those patterns hold across multiple regions when portfolios account for hemispheric differences in peak seasons. Data released in May 2026 continues to align with these established rhythms rather than signaling structural departures. Investors and analysts who incorporate these recurring dynamics into portfolio construction gain clearer visibility into expected cash return timing from gaming equities.