Tracing the Impact of Mobile Gaming Adoption on Equity Return Frameworks for Brick-and-Mortar Operators
Amir Richter · Jul 15, 2026
Tracing the Impact of Mobile Gaming Adoption on Equity Return Frameworks for Brick-and-Mortar Operators
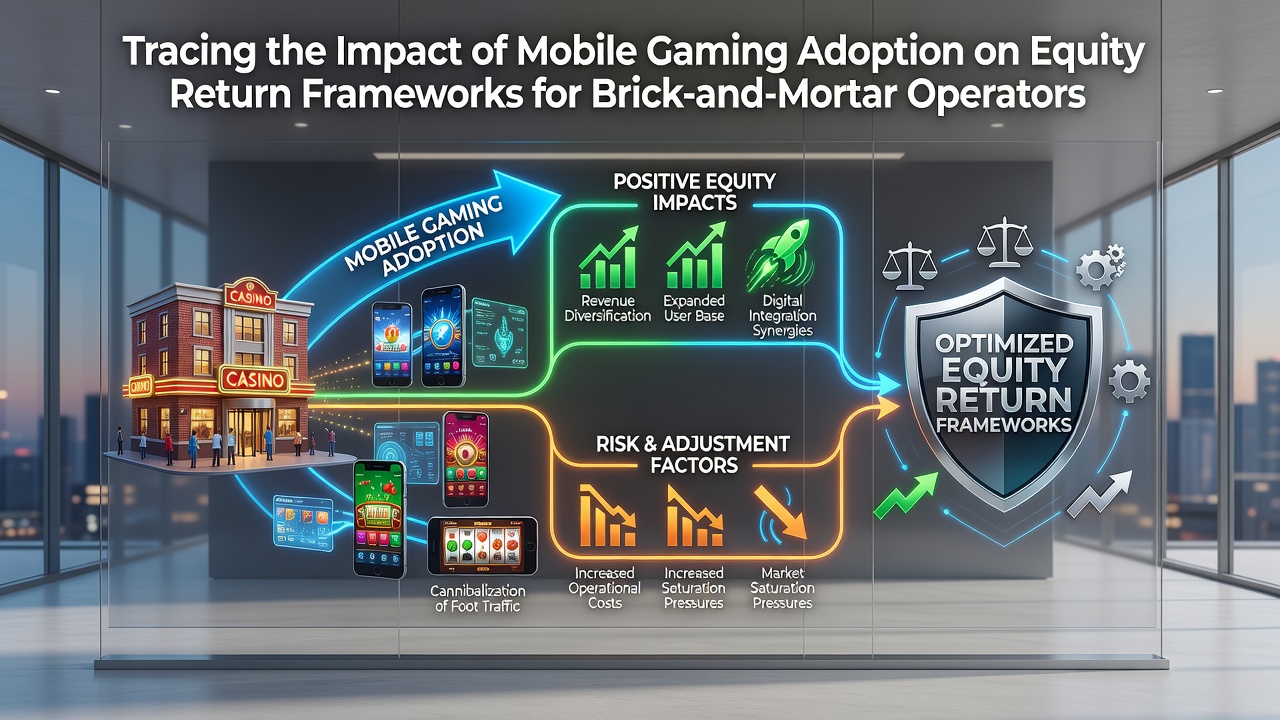
Brick-and-mortar casino operators have watched mobile gaming platforms capture increasing shares of total wagering activity since the mid-2010s, and this shift has prompted measurable adjustments in how those operators structure equity returns for shareholders. Data from multiple jurisdictions shows that digital channels now account for substantial portions of overall gaming revenue, which in turn influences decisions around dividend policies, share repurchase programs, and capital reinvestment timelines at physical venues.
Operators in mature markets such as Nevada and New Jersey report that mobile adoption rates climbed steadily through 2025 and into the first half of 2026, with mobile devices facilitating a growing percentage of sports wagers and slot-style games. This pattern has coincided with slower growth or outright declines in foot traffic at some regional properties, prompting finance teams to recalibrate payout ratios to maintain investor returns while funding necessary property upgrades.
Shifts in Revenue Composition Across Regions
Figures released by the Nevada Gaming Control Board indicate that mobile sports betting handled through licensed apps surpassed on-site sports books at several major resorts by early 2026, while table games and slots at physical locations retained stronger in-person appeal. Similar trends appear in Pennsylvania, where online casino revenue growth has outpaced land-based increments in recent quarters. These changes alter the timing and predictability of cash flows that historically supported consistent dividend distributions from integrated resort groups.
One analysis conducted by the Australian Gambling Research Centre found that operators with significant physical footprints experienced compressed margins on traditional gaming segments once mobile alternatives became widely available, leading several firms to revise long-term capital return models. The study noted that properties located farther from urban centers felt the effects more acutely because mobile users could access the same game libraries without travel costs.
Adjustments to Dividend and Repurchase Strategies
Equity return frameworks at publicly traded gaming companies have incorporated more flexible payout schedules as mobile volumes expand. Companies that once targeted fixed annual dividend growth rates now tie portions of distributions to digital segment performance, allowing management to preserve liquidity during periods when physical property revenues lag. Share buyback authorizations have also become more common, providing an alternative mechanism for returning capital when dividend stability faces pressure from shifting player preferences.
Observers tracking Canadian operators note that firms with both online and land-based portfolios have begun allocating a larger share of free cash flow toward technology partnerships rather than immediate shareholder distributions. This approach supports platform development while still delivering returns through periodic special dividends tied to strong quarters in either channel.
Capital Allocation and Property Investment Timelines
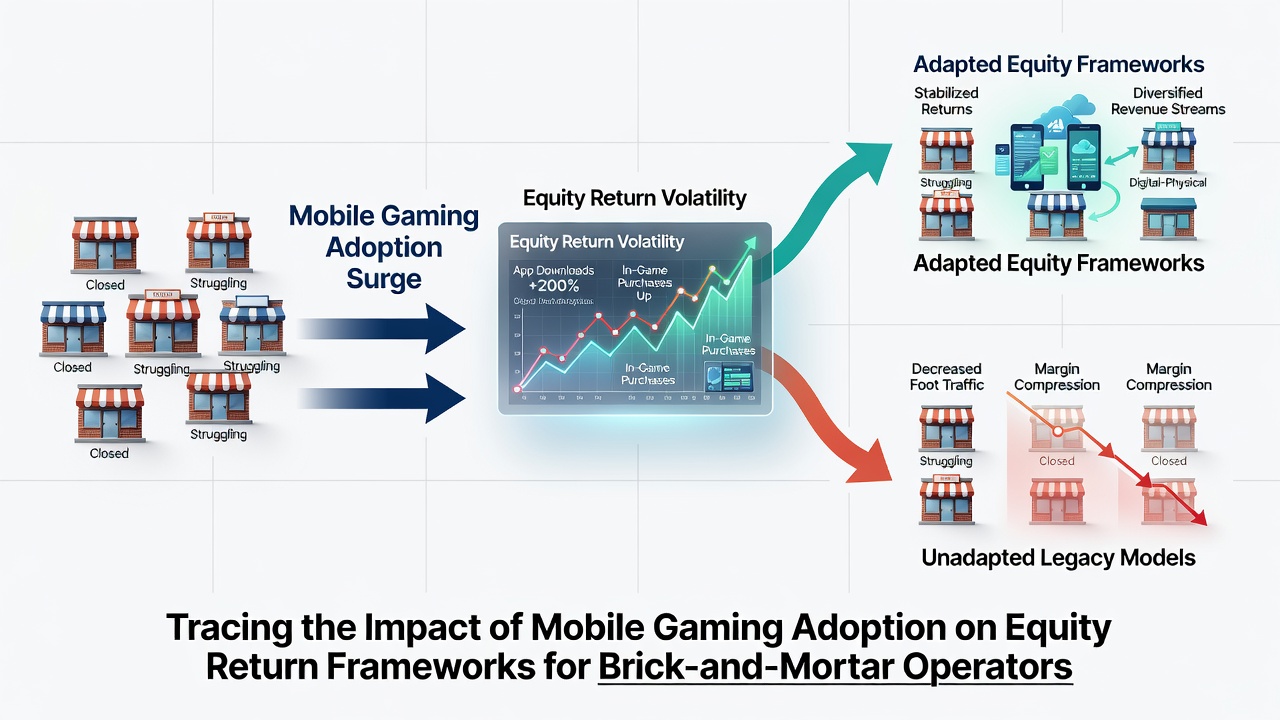
Physical casino expansions and renovations now compete with mobile platform investments for available capital, which has lengthened decision cycles for some regional operators. Projects that once received swift board approval face extended review periods while teams model potential revenue cannibalization from digital offerings. In July 2026 several mid-sized U.S. operators announced delayed timelines for slot floor upgrades, citing the need to first stabilize digital user acquisition costs before committing additional resources to physical assets.
Those who've examined balance sheets across multiple operators point out that debt service obligations remain a priority, yet the composition of earnings before interest and taxes has tilted toward digital contributions at larger groups. This rebalancing supports continued access to credit markets even when land-based metrics soften, thereby sustaining overall capacity for equity returns.
Regulatory and Market Context Influencing Outcomes
State-level decisions on mobile gaming licensing continue to shape competitive dynamics. Jurisdictions that authorized online products earlier tend to show more pronounced effects on physical property performance, whereas states with later rollouts still record steadier land-based growth. Tax structures applied differently to online versus in-person play further complicate return calculations, prompting operators to model scenario-based dividend policies rather than fixed targets.
Research from the Canadian Gaming Association highlights that integrated operators maintain higher overall payout ratios when both channels perform strongly, whereas those reliant primarily on physical venues have adopted more conservative distribution frameworks. The association's data underscores that geographic diversification across markets with varying mobile penetration rates helps stabilize aggregate returns.
Conclusion
Patterns emerging through mid-2026 demonstrate that mobile gaming adoption has prompted brick-and-mortar operators to refine equity return frameworks by introducing greater flexibility in dividend timing, increasing use of share repurchases, and extending evaluation periods for physical property investments. Data from regulatory bodies and industry research groups show these adjustments vary by jurisdiction and operator scale, yet the underlying shift in revenue composition remains consistent across tracked markets. Continued monitoring of mobile versus land-based performance metrics will likely drive further refinements in capital allocation models at gaming companies with significant physical footprints.