Venue Visitor Trends Reshaping Owner Benefit Timelines in Leisure Entertainment Groups
Kai Neumann · Jun 3, 2026
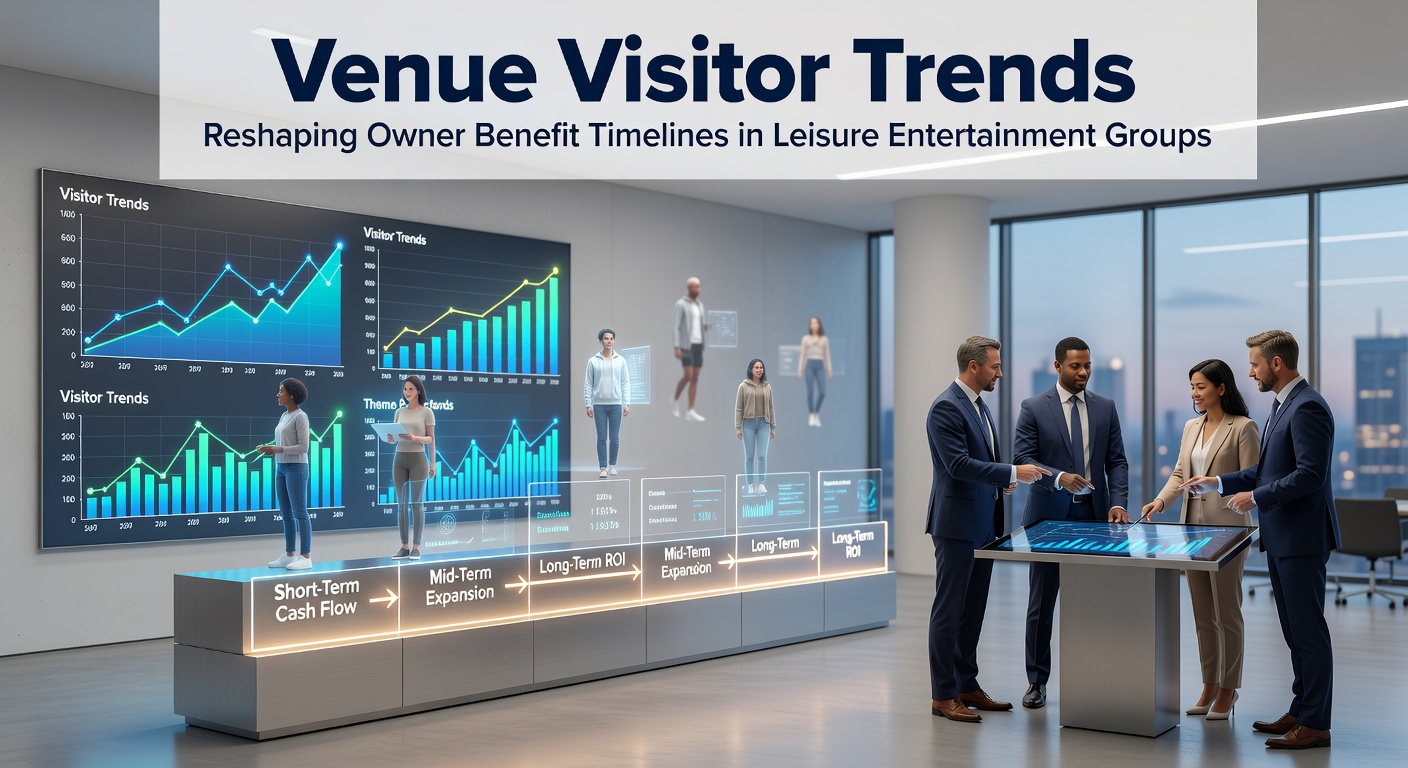
Venue Visitor Trends Reshaping Owner Benefit Timelines in Leisure Entertainment Groups
Leisure entertainment groups operate large venues that combine amusement parks, live performance spaces, resort properties, and dining complexes, and visitor trends now influence when owners realize financial returns on their investments. Attendance data collected across multiple regions shows that traditional seasonal peaks have flattened in many markets while shoulder periods have gained strength, which directly alters cash flow projections and capital recovery schedules. Operators track these shifts through booking platforms and entry scanners that record daily foot traffic, and the resulting datasets feed into models used by financial planners to adjust benefit timelines.
Changing Attendance Patterns Across Major Markets
Research compiled by national tourism agencies indicates that mid-week visits to integrated entertainment complexes rose by 14 percent between 2023 and 2025 in North America and parts of Asia, while weekend surges moderated. This redistribution stems from flexible work arrangements that allow households to schedule trips outside traditional Friday-to-Sunday windows, and venue operators have responded by extending operating hours on Tuesdays and Wednesdays. The Australian Bureau of Statistics reported similar weekday gains at major theme park destinations in 2025, noting that families increasingly combined visits with regional travel packages rather than single-day excursions.
Demographic data further reveals that visitors aged 35 to 54 now represent the fastest-growing segment at many multi-use sites, whereas younger cohorts show more variable participation tied to economic conditions and digital entertainment alternatives. These groups tend to spend more per visit on premium experiences yet book further in advance, which compresses last-minute revenue opportunities that previously supported quicker payback periods for owners.
Effects on Capital Return Schedules
Longer benefit timelines appear when attendance spreads across more months but delivers lower daily volumes, because fixed costs such as maintenance, staffing, and debt service remain constant. Financial reports from publicly listed leisure operators show that average payback periods for new attraction investments extended from 4.2 years in 2019 to 5.8 years by early 2026 in several cases, according to filings reviewed by industry analysts. This extension occurs even when total annual visitors remain stable, because the timing of revenue recognition shifts away from concentrated high-yield periods.
Technology and Booking Behavior
Digital reservation systems now capture roughly 68 percent of advance ticket sales at large leisure venues, according to data released by the International Association of Amusement Parks and Attractions. These platforms enable dynamic pricing that operators adjust based on projected demand, yet they also create more predictable revenue streams that stretch across quarters rather than clustering around holidays. One operator in the Midwest United States implemented time-slot reservations in 2024 and recorded a 22 percent increase in off-peak attendance within twelve months, which smoothed monthly cash flows but reduced the intensity of peak-period margins that once accelerated owner returns.
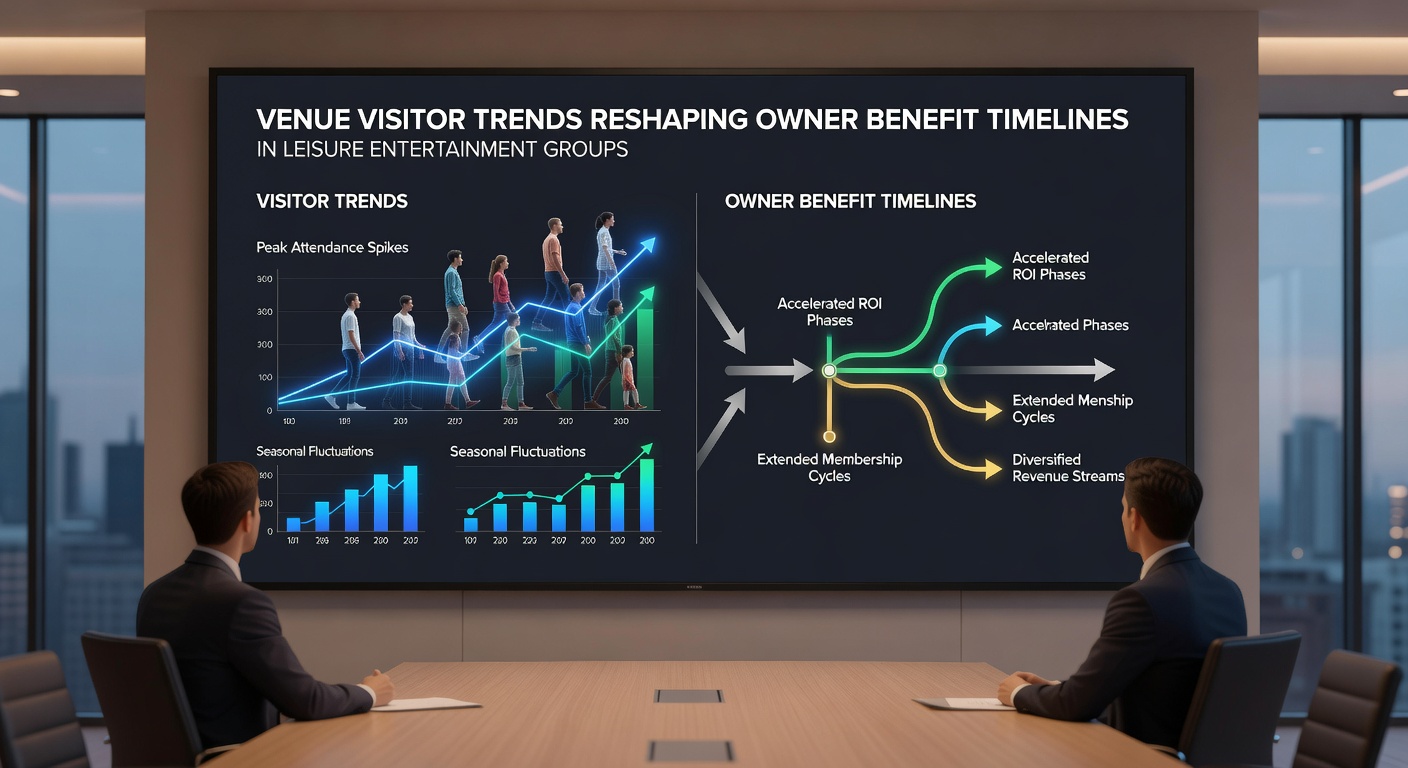
Observers note that subscription-style annual passes have gained traction, particularly in Europe and Australia, where operators bundle access across multiple sites. These memberships generate steady monthly revenue that appears on balance sheets earlier than single-ticket sales, yet they also require operators to deliver consistent value throughout the year rather than relying on sporadic high-traffic events. The result is a recalibration of when owners can allocate surplus funds toward debt reduction or expansion projects.
Regional Differences in Recovery and Growth
Markets in Southeast Asia experienced sharper rebounds in group and corporate bookings during the first half of 2026, with data from regional tourism boards showing that incentive travel contributed to steadier mid-year attendance. In contrast, some North American destinations reported continued softness in corporate events through June 2026, which lengthened the interval before new capital projects reached positive cash flow. European operators faced additional variability linked to energy costs and transportation pricing, factors that encouraged more regional rather than international visitors and further dispersed spending patterns.
Studies published by university tourism research centers have documented how these geographic variations interact with ownership structures, because publicly traded groups often manage portfolios spanning multiple continents and must balance faster-recovering Asian assets against slower North American properties when reporting consolidated returns.
Operational Adjustments and Timeline Implications
Venue managers have introduced staggered showtimes, expanded food-and-beverage offerings during slower periods, and partnered with nearby hotels to create bundled packages that encourage longer stays. These measures increase total revenue per visitor yet require upfront investment that extends the period before net benefits materialize for owners. Labor scheduling systems now rely on predictive analytics that align staffing levels with forecasted attendance, which reduces variable costs during low-traffic intervals and partially offsets the stretched timelines.
Insurance and financing agreements have also adapted, with lenders incorporating attendance volatility clauses that tie interest rates or repayment schedules to quarterly visitor metrics rather than annual totals. Such arrangements reflect the recognition that benefit realization now depends more on consistency than on peak intensity.
Conclusion
Visitor trend data through mid-2026 demonstrates that leisure entertainment groups face more distributed attendance patterns that reshape the pace at which owners recover capital and generate ongoing benefits. Operators continue to refine pricing, programming, and partnership strategies in response to these shifts, while financial models incorporate longer recovery horizons. The interplay between demographic preferences, technological booking tools, and regional economic conditions will likely sustain this evolution in revenue timing for the foreseeable future.